
In this blog, we are going to see the 15 most used pandas functions for Data Analysis or Data Science. If you want to go into the field of data analysis or data science then you must know these pandas' functions. So without wasting any time let's start this article:-

Python is one of the most widely used languages for data analysis and data science. Python is easy to learn, has a great online community of learners and educators, and has some very powerful data center libraries.
Pandas is one of the most important Python libraries for data analysis and data science. We can install the panda's library by installing pandas. After installation, we need to import pandas from the current session every time.
To explain these pandas' functions, I have used Mobile Phones data which is widely available on Kaggle and you can download it from the below link:
No.1: Read the CSV file
To read the CSV file using the panda's library, we can use this command read_csv(). There are mostly two most used data read formats that are popular first is CSV and the second is Excel. But mostly CSV formate is used everywhere so we have discussed below it.
df = pd.read_csv("phones_data.csv")

No.2: Get 5 Rows from Top or Bottom(Head and Tail)
df.head(): If you want to access the first five rows of the dataset then you can use the head() function, and it will return by default the first five rows of the dataset. If you want to access more than five rows then you will have to put a number of rows inside the head() function to get the specific no of rows.

df.tail(): The tail() is used to return by default the last five rows of the dataset and you can get more data from the last to put a range inside the tail() function.

No.3: Get Information about the Dataset
If you want to get more details about your dataset then use these methods.
df.shape: This method will return the total number of rows and then columns of your dataset. If you don't know how many rows and columns are available in your dataset then you can use this method.

df.info(): The info() function returns information about the data frame. It includes the number of columns, column labels, column data type, memory usage, range index, and the number of cells in each existing column (non-zero values).

len(df): If you want to get the length of the Dataframe in the dataset then use len(df) function, it will return the total no of rows.
Discover More
No.4: df.isna()
df.isna() : This method will return the true or false available in each column's data. If you want to see how many null values are available in a column then use df.isna() function to get the null values and you can also get a sum of null values like df.isna().sum().

df.isnull().sum() : It will return the total number of null values available in each column.

No.5: Check unique values
df.column_name.unique( )
This function returns the total number of unique values in each column of the data set.

If you want to check the unique value of a specific column then use this function like
df.column_name.nunique(). It will return the unique value of that column.

No.6: df.describe()
To implement the describe() function, it returns a summary or descriptive statistics of your data set. This function only works when the data is in numeric form. It gives you the count, average, standard deviation, and also a 5-number summary.

No.7: df.iloc() & df.loc()
The iloc[:] function takes the row and column index parameters and returns a subset of the data frames to you. It is the same as we used to get slice value of data in python programming like [0:5].

The loc[:] function is almost the same as .iloc(). Here we can specify exactly which row index we want and also specify the column names.
No.8: Check the Datatype of the Dataset
df.dtypes
Understanding the nature of your data and the data type of each column is critical for data disputes to perform relevant operations quickly.

No.9: Drop Columns
df.drop( )
There are unnecessary columns in the dataset that you really need. So, to get rid of the unnecessary columns, let's use the function
No.10: drop_duplicates()
df.drop_duplicates(inplace=True) returns a Pandas DataFrame with duplicate rows removed. Even with duplicates, there is an option to save the first occurrence(a record) of the duplicate or the last. You can also specify the inplace and ignore_index attributes.
No.11: Sorting Values
df.sort_values(by='ID', inplace=True)
sort_values() is used to sort the columns in a Pandas DataFrame (or Pandas Array) by values in ascending or descending order. By setting the inplace attribute as true, you can immediately make changes to the original DataFrame.
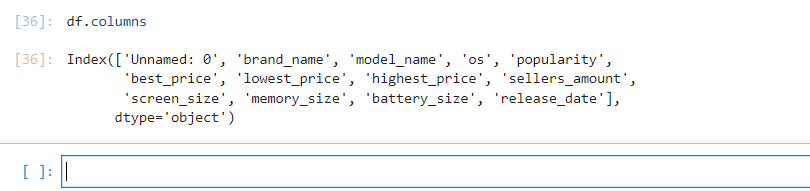
No.12: Get All Columns
If you want to know the names of all the columns available in your data frame, we can use df.columns, It will return all the column names available in your dataset.
No.13: Rename the column Name
We can rename specific columns of the dataset using df.rename() function and here is the syntax for renaming any column name.
Syntax:
df.rename(columns = {“Old_name”: “New_name”})
No.14: fillna()
df['memory_size'].fillna(88, inplace=True)
If you want to replace any blank value from a column then you can use fillna(). It will replace a blank value with any word or number. The above code replaces all empty 'Name' records with NULL. Missing values can be calculated by means, median, mode, or other values. In our case, we choose the average.
No.15: Group By
groupby() is used to group the data according to the categories and apply a function to the categories or you can split your data into separate groups to perform computations for better analysis
Conclusion:
These functions are very common for data pre-processing in the first step. There are many more useful features that can be used depending on conditions and needs. So we have successfully covered the 15 most used pandas functions for Data Analysis and Data Science.
You should also check out, Django Developer Roadmap, Python Developer Roadmap, C++ Complete Roadmap, Machine Learning Complete Roadmap, Data Scientist Learning Roadmap, R Developer Roadmap, DevOps Learning Roadmap, and Laravel Developer Roadmap.
Do you have any queries related to This Article, Please mention them in the Comment Section of this Article, We will contact you soon.
Thank you for reading this blog. I wish you the best in your journey in learning and mastering Pandas library.
Follow me to receive more useful content:
Instagram | Twitter | Linkedin | Youtube
Thank you